September 2025 vs. September 2024
The number of active listings in Orangeville increased by 19.23% in September 2025 vs. September 2024. 13 more listings came on the Toronto Regional Real Estate Board in September 2025 vs. September 2024, which is an increase of 15.85%. The number of homes sold increased by 13 or 43.33% in September 2025 vs. September 2024. The average days on the market decreased from 32 days to 31 days. Average sale prices were up by 2.63%.
Year to Date 2025 vs. Year to Date 2024
The number of homes listed in Orangeville, year-to-date increased from 730 to 762, which is an increase of 4.38%. The number of homes sold decreased from 334 to 303 which is a decrease of 9.28%. The average days on the market increased from 27 days to 34 days. Average sale prices were down year over year by 2.85%.
%20Stats%20Sept%202025.jpg)


%20Trends%20Sept%202025.jpg)


%20Stats%20August%202025.jpg)


%20Trends%20August%202025.jpg)


%20Stats%20July%202025.jpg)


%20Trends%20July%202025.jpg)


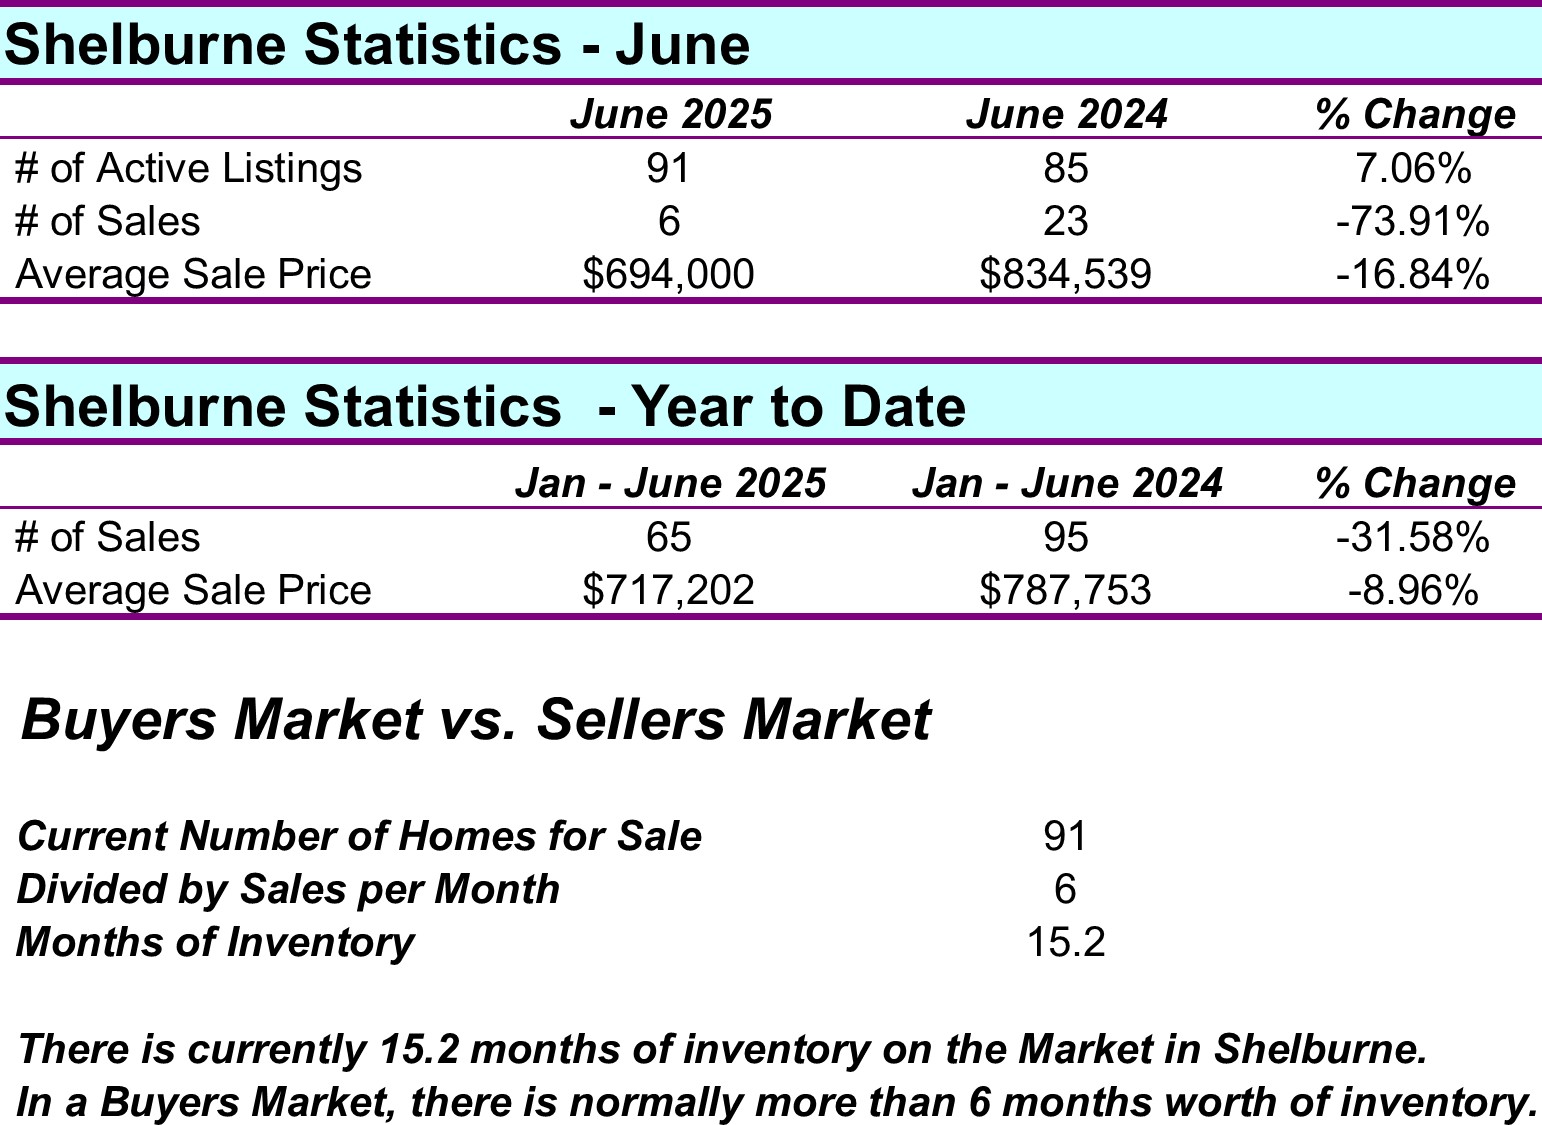
%20Stats%20June%202025.jpg)