Monday, May 10, 2021

Orangeville Market Statistics, April 2021


April 2021 vs. April 2020

The number of active listings in Orangeville decreased by 43.55% in April 2021 vs. April 2020. 55 more listings came on the Toronto Regional Real Estate Board in April 2021 vs. April 2020, which is an increase of 166.67%. The number of homes sold increased by 69 homes or 492.86%. The average days on the market decreased from 21 to 10 days. Average sale prices were up by 45.42%.

Year to Date 2021 vs. Year to Date 2020
The number of homes listed in Orangeville, year-to-date increased from 230 to 352, which is an increase of 53.04%. The number of homes sold increased by 143 homes. The average days on the market decreased from 17 to 9 days. Average sale prices were up year over year by 31.02%.

Dufferin (Excluding Orangeville) Market Statistics, April 2021


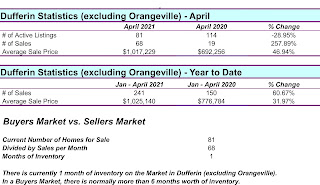
April 2021 vs. April 2020

The number of active listings in Dufferin (excluding Orangeville) decreased by 28.95% in April 2021 over the same month in 2020. The number of homes sold increased by 49 homes or 257.89% in April 2021. Average sale prices increased by 46.94%.

Year to Date 2020 vs. Year to Date 2019
The number of homes sold increased by 91 homes in April 2021 over the same month in 2020. Average sale prices were up by 31.97%.

Caledon Market Statistics, April 2021


April 2021 vs. April 2020

The number of active listings in Caledon decreased by 31.82% in April 2021 over the same month in 2020. The number of listings that came on the Toronto Regional Real Estate Board in April 2021 vs. April 2020 increased by 158 homes or 173.63%. The number of homes sold increased by 138 homes or 657.14%. The average days on the market decreased from 44 days to 11 days. Average sale prices were up by 42.71%. 

Year to Date 2021 vs. Year to Date 2020
The number of homes listed in Caledon, year-to-date increased from 511 to 791, which is an increase of 54.79%. The number of homes sold increased by 294 homes or 131.84%. The average days on market decreased from 23 days to 12 days. Average sale prices were up by 39.92%.

New Tecumseth Market Statistics, April 2021


April 2021 vs. April 2020

The number of active listings in New Tecumseth decreased from 124 to 96 homes or 22.58% in April 2021 over the same month in 2020. The amount of listings that came on the Toronto Regional Real Estate Board increased in April 2021 vs. April 2020. The number of homes sold increased by 92 homes or 353.85%. The average days on the market decreased by 15 days, from 26 days to 11 days. Average sale prices were up by 32.04%.

Year to Date 2021 vs. Year to Date 2020
The number of homes listed in New Tecumseth, year-to-date increased by 244 homes or 72.84%. The number of homes sold increased by 202 homes or 95.73%. The average days on the market decreased by 23 days, from 34 days to 10 days. Average sale prices were up year over year by 30.26%.

Wellington Market Statistics, April 2021


April 2021 vs. April 2020

The number of active listings in Wellington decreased by 6.75% in April 2021 over the same month in 2020. The number of homes sold increased by 244 sales or 469.23%. Average sale prices increased by 15.51%.

Year to Date 2021 vs. Year to Date 2020
The number of homes sold increased by 529 sales. Average sale prices increased year over year by 32.06%.  


April 2021 vs. April 2020
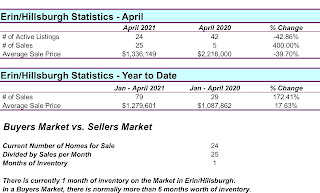
The number of active listings in Erin/Hillsburgh decreased by 18 listings or 42.86% in April 2021 over the same month in 2020. The number of homes sold increased by 20 sales or 400%. Average sale prices decreased by 39.70%.

Year to Date 2021 vs. Year to Date 2020
The number of homes sold increased by 50 sales or 172.41%. Average sale prices increased year over year by 17.63%.

Tuesday, May 4, 2021