
March 2024 vs. March 2023
The number of active listings in Orangeville increased by 3.17% in March 2024 vs. March 2023. 21 more listings came on the Toronto Regional Real Estate Board in March 2024 vs. March 2023, which is an increase of 32.31%. The number of homes sold increased by 8 homes or 26.67%. The average days on the market decreased from 17 days to 16 days. Average sale prices were up by 6.97%.
Year to Date 2024 vs. Year to Date 2023
The number of homes listed in Orangeville, year-to-date increased from 149 to 193, which is a increase of 29.53%. The number of homes sold increased from 77 to 100 which is a increase of 29.87%. The average days on the market remained the same at 25 days. Average sale prices were down year over year by 1.21%.
%20Stats%20March%202024.jpg)


%20Trends%20March%202024.jpg)


%20Stats%20Feb%202024.jpg)


%20Trends%20Feb%202024.jpg)


%20Stats%20January%202024.jpg)


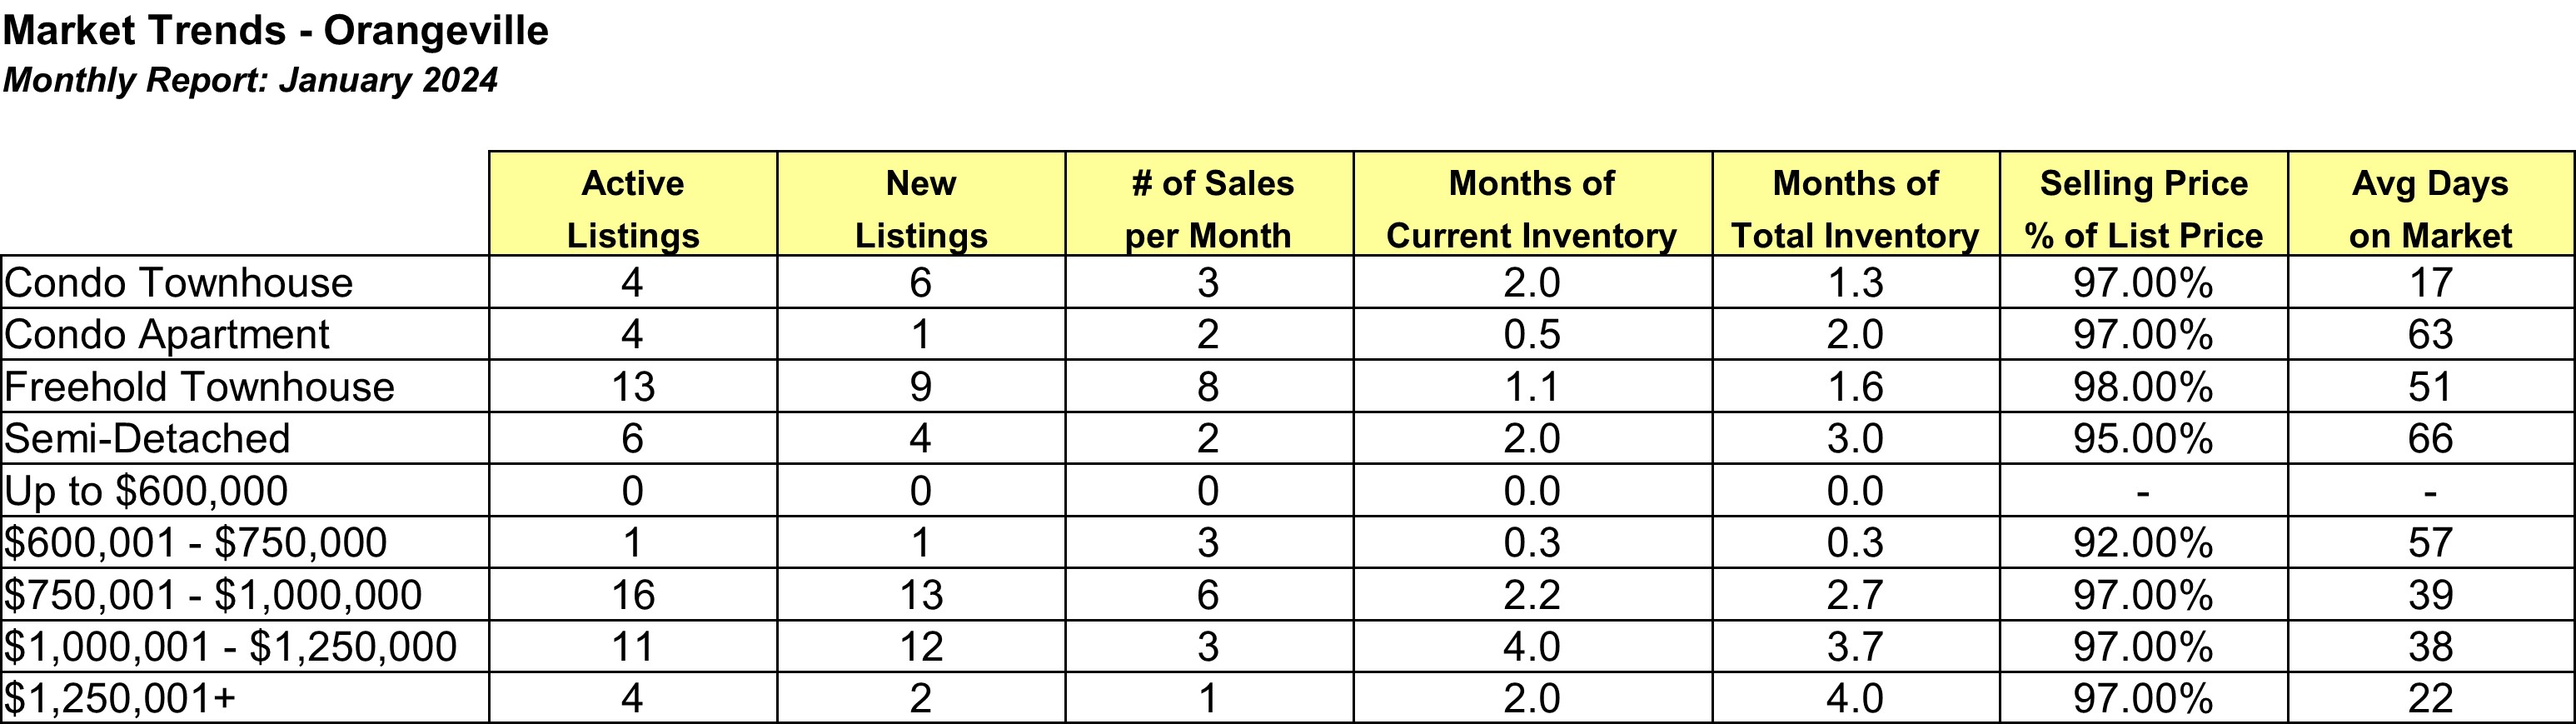
%20Market%20Trends%20January%202024.jpg)


%20Stats%20Dec%202023.jpg)


%20Market%20Trends%20Dec%202023.jpg)


