Friday, December 14, 2012

Orangeville Market Statistics, November 2012


November, 2012 vs. November, 2011
The number of active listings in Orangeville decreased by 23.70% in November, 2012 vs. November, 2011. 13 less listings came on the Toronto Board in November, 2012 vs. November, 2011, which is a decrease of 23.64%. The number of homes sold increased by 15.00% or 6 homes. The average days on the market increased from 36 to 44 days. Average sale prices were up by 12.61%.

Year to Date, 2012 vs. Year to Date, 2011
The number of homes listed in Orangeville, year-to-date decreased from 882 to 825, which is a decrease of 6.46%. The number of homes sold increased by 5.32%. The average days on the market increased from 35 to 37 days. Average sale prices were up year over year by 7.24%.


Dufferin (Excluding Orangeville) Market Statistics, November 2012


November, 2012 vs. November, 2011 
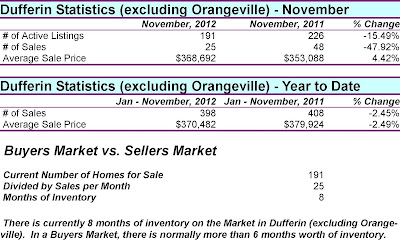
The number of active listings in Dufferin (excluding Orangeville) decreased by 15.49% in November, 2012 over the same month in 2011. The number of homes sold decreased by 47.92% or 23 homes. Average sale prices increased by 4.42%.

Year to Date, 2012 vs. Year to Date, 2011
The number of homes sold decreased from 408 to 398 homes or 2.45%. Average sale prices were down year over year by 2.49%.

Caledon Market Statistics, November 2012


November, 2012 vs. November, 2011
The number of active listings in Caledon increased by 15.32% in November, 2012 over the same month in 2011. 8 more listings came on the Toronto Board in November, 2012 vs. November, 2011, which is an increase of 9.64%. The number of homes sold decreased by 4 homes or 7.27%. The average days on the market decreased from 51 to 38. Average sale prices were down by 2.79%.

Year to Date, 2012 vs. Year to Date, 2011 
The number of homes listed in Caledon, year-to-date increased from 1,503 to 1,401, which is a increase of 7.28%. The number of homes sold increased by 4 homes or 0.52%. The average days on the market increased from 32 to 33. Average sale prices were up year over year by 7.91%.

Wellington Market Statistics, November 2012


November, 2012 vs. November, 2011
The number of active listings in Wellington decreased by 19.11% in November, 2012 over the same month in 2011. The number of homes sold increased by 2.17% from 46 to 47 sales. Average sale prices were up by 4.23%.

Year to Date, 2012 vs. Year to Date, 2011
The number of homes sold increased by 40.13%. Average sale prices decreased year over year by 1.47%.

Wednesday, December 12, 2012

2012 November Market Trends

Click on images to enlarge.


Friday, November 16, 2012

Orangeville Market Statistics, October 2012


October, 2012 vs. October, 2011
The number of active listings in Orangeville decreased by 12.24% in October, 2012 vs. October, 2011. 11 more listings came on the Toronto Board in October, 2012 vs. October, 2011, which is a increase of 14.67%. The number of homes sold increased by 13.04% or 6 homes. The average days on the market decreased from 34 to 33 days. Average sale prices were up by 1.80%.

Year to Date, 2012 vs. Year to Date, 2011
The number of homes listed in Orangeville, year-to-date decreased from 827 to 779, which is a decrease of 5.80%. The number of homes sold increased by 4.96%. The average days on the market increased from 35 to 37 days. Average sale prices were up year over year by 7.11%.

Dufferin (Excluding Orangeville) Market Statistics, October 2012


October, 2012 vs. October, 2011 
The number of active listings in Dufferin (excluding Orangeville) decreased by 17.44% in October, 2012 over the same month in 2011. The number of homes sold decreased by 28.00% or 14 homes. Average sale prices increased by 2.43%.

Year to Date, 2012 vs. Year to Date, 2011
The number of homes sold increased from 361 to 373 homes or 3.32%. Average sale prices were down year over year by 3.34%.

Caledon Market Statistics, October 2012


October, 2012 vs. October, 2011
The number of active listings in Caledon increased by 16.36% in October, 2012 over the same month in 2011. 12 more listings came on the Toronto Board in October, 2012 vs. October, 2011, which is an increase of 9.92%. The number of homes sold decreased by 19 homes or 23.75%. The average days on the market decreased from 34 to 33. Average sale prices were up by 1.42%.

Year to Date, 2012 vs. Year to Date, 2011 
The number of homes listed in Caledon, year-to-date increased from 1, 318 to 1, 405, which is a increase of 6.60%. The number of homes sold increased by 7 homes or 0.98%. The average days on the market increased from 31 to 33. Average sale prices were up year over year by 8.43%

Wellington Market Statistics, October 2012


October, 2012 vs. October, 2011
The number of active listings in Wellington decreased by 9.87% in October, 2012 over the same month in 2011. The number of homes sold increased by 28.26% from 46 to 59 sales. Average sale prices were down by 9.10%.

Year to Date, 2012 vs. Year to Date, 2011
The number of homes sold increased by 29.82%. Average sale prices decreased year over year by 2.64%.

2012 October Market Trends

Click on charts to enlarge.


Friday, October 5, 2012

Orangeville Market Statistics, September 2012


September, 2012 vs. September, 2011
The number of active listings in Orangeville decreased by 18.24% in September, 2012 vs. September, 2011. 27 less listings came on the Toronto Board in September, 2012 vs. September, 2011, which is a decrease of 29.35%. The number of homes sold decreased by 16.33% or 8 homes. The average days on the market increased from 39 to 49 days. Average sale prices were up by 0.22%.

Year to Date, 2012 vs. Year to Date, 2011
The number of homes listed in Orangeville, year-to-date decreased from 751 to 693, which is a decrease of 7.72%. The number of homes sold increased by 4.60%. The average days on the market increased from 35 to 37 days. Average sale were up year over year by 6.95%.

Dufferin (Excluding Orangeville) Market Statistics, September 2012


September, 2012 vs. September, 2011
The number of active listings in Dufferin (excluding Orangeville) decreased by 26.89% in September, 2012 over the same month in 2011. The number of homes sold decreased by 15.38% or 6 homes. Average sale prices were decreased by 0.64%.

Year to Date, 2012 vs. Year to Date, 2011
The number of homes sold increased from 331 to 337 homes or 1.81%. Average sale prices were down year over year by 5.60%.

Caledon Market Statistics, September 2012


September, 2012 vs. September, 2011
The number of active listings in Caledon increased by 9.09% in September, 2012 over the same month in 2011. 2 less listings came on the Toronto Board in September, 2012 vs. September, 2011, which is an decrease of 1.23%. The number of homes sold decreased by 8 homes or 10.39%. The average days on the market increased from 36 to 32. Average sale prices were up by 8.69%.

Year to Date, 2012 vs. Year to Date, 2011
The number of homes listed in Caledon, year-to-date increased from 1, 272 to 1, 197, which is a increase of 6.27%. The number of homes sold increased by 23 home or 3.60%. The average days on the market increased from 30 to 32. Average sale prices were up year over year by 8.77%

Wellington Market Statistics, September 2012

 
September, 2012 vs. September, 2011
The number of active listings in Wellington decreased by 11.32% in September, 2012 over the same month in 2011. The number of homes sold decreased by 23.21% from 56 to 43 sales. Average sale prices were down by 3.72%.

Year to Date, 2012 vs. Year to Date, 2011
The number of homes sold increased by 22.20%. Average sale prices increased year over year by 4.64%.

2012 September Market Trends

 
Click on charts to enlarge.


Thursday, September 13, 2012

Orangeville Market Statistics, August 2012

 
August, 2012 vs. August, 2011
The number of active listings in Orangeville decreased by 17.99% in August, 2012 vs. August, 2011. 16 fewer listings came on the Toronto Board in August, 2012 over the same month in 2011, which is a decrease of 21.05%. The number of homes sold decreased by 15.22% or 13 homes. The average days on the market decreased from 45 to 32 days. Average sale prices were up by 11.15%.

Year to Date, 2012 vs. Year to Date, 2011
The number of homes listed in Orangeville, year-to-date decreased from 660 to 627, which is a decrease of 5.00%. The number of homes sold increased by 7.44%. The average days on the market increased from 35 to 36 days. Average sale were up year over year by 7.59%.


Dufferin (Excluding Orangeville) Market Statistics, August 2012

 
August, 2012 vs. August, 2011
The number of active listings in Dufferin (excluding Orangeville) decreased by 27.88% in August, 2012 over the same month in 2011. The number of homes sold decreased by 5.88% or 2 homes. Average sale prices were decreased by 3.55%.

Year to Date, 2012 vs. Year to Date, 2011
The number of homes sold increased from 268 to 304 homes or 13.43%. Average sale prices were down year over year by 2.47%.

Caledon Market Statistics, August 2012

 
August, 2012 vs. August, 2011
The number of active listings in Caledon increased by 4.32% in August, 2012 over the same month in 2011. No more listings came on the Toronto Board in August, 2012 vs. August, 2011. The number of homes sold decreased by 7 homes or 10.61%. The average days on the market increased from 36 to 42 days. Average sale prices were up by 8.51%.

Year to Date, 2012 vs. Year to Date, 2011
The number of homes listed in Caledon, year-to-date increased from 1,034 to 1,113, which is an increase of 7.64%. The number of homes sold increased by 30 homes or 5.30%. The average days on the market increased from 30 to 32. Average sale prices were up year over year by 8.73%

Wellington Market Statistics, August 2012


August, 2012 vs. August, 2011
The number of active listings in Wellington decreased by 5.98% in August, 2012 over the same month in 2011. The number of homes sold increased by 46.15% from 52 to 76 sales. Average sale prices were down by 5.05%.

Year to Date, 2012 vs. Year to Date, 2011
The number of homes sold increased by 38.27%. Average sale prices increased year over year by 2.54%.

2012 August Market Trends

 
Click on charts to enlarge.


Friday, August 3, 2012

Orangeville Market Statistics, July 2012


July, 2012 vs. July, 2011
The number of active listings in Orangeville decreased by 22.22% in July, 2012 vs. July, 2011. 27 less listings came on the Toronto Board in July, 2012 over the same month in 2011, which is a decrease of 30.68%. The number of homes sold increased by 42.86% or 21 homes. The average days on the market decreased from 38 to 32 days. Average sale prices were up by 6.03%.

Year to Date, 2012 vs. Year to Date, 2011
The number of homes listed in Orangeville, year-to-date decreased from 584 to 567, which is a decrease of 2.91%. The number of homes sold increased by 10.88%. The average days on the market increased from 34 to 37 days. Average sales were up year over year by 7.53%.

Wellington Market Statistics, July 2012


July, 2012 vs. July, 2011
The number of active listings in Wellington increased by 0.68% in July, 2012 over the same month in 2011. The number of homes sold increased by 33.33% from 45 to 60 sales. Average sale prices were up by 7.07%.

Year to Date, 2012 vs. Year to Date, 2011
The number of homes sold increased by 35.35%. Average sale prices decreased year over year by 5.90%.

Dufferin (excluding Orangeville) Market Statistics, July 2012


July, 2012 vs. July, 2011
The number of active listings in Dufferin (excluding Orangeville) decreased by 28.88% in July, 2012 over the same month in 2011. The number of homes sold increased by 17.95% or 7 homes. Average sale prices were decreased by 6.34%.

Year to Date, 2012 vs. Year to Date, 2011
The number of homes sold increased from 234 to 274 homes or 17.09%. Average sale prices were down year over year by 1.02%.

Caledon Market Statistics, July 2012


July, 2012 vs. July, 2011

The number of active listings in Caledon decreased by 1.82% in July, 2012 over the same month in 2011. 7 more listings came on the Toronto Board in July, 2012 vs. July, 2011, which is an increase of 6.25%. The number of homes sold increased by 22 homes or 33.33%. The average days on the market decreased from 34 to 33 days. Average sale prices were up by 0.81%.

Year to Date, 2012 vs. Year to Date, 2011
The number of homes listed in Caledon, year-to-date increased from 902 to 983, which is an increase of 8.98%. The number of homes sold increased by 39 homes or 7.80%. The average days on the market increased from 30 to 31. Average sale prices were up year over year by 8.64%

2012 July Market Trends

Click on charts to enlarge.


Monday, July 9, 2012

Orangeville Market Statistics, June 2012


June, 2012 vs. June, 2011
 The number of active listings in Orangeville decreased by 8.40% in June, 2012 vs. June, 2011. 17 more listings came on the Toronto Board in June, 2012 over the same month in 2011, which is a increase of 21.52%. The number of homes sold increased by 10.14% or 7 homes. The average days on the market increased from 27 to 42 days. Average sale prices were up by 18.31%.

Year to Date, 2012 vs. Year to Date, 2011
The number of homes listed in Orangeville, year-to-date increased from 501 to 506, which is a increase of 1.00%. The number of homes sold increased by 6.82%. The average days on the market increased from 33 to 38 days. Average sale were up year over year by 7.80%.

Dufferin (excluding Orangeville) Market Statistics, June 2012


June, 2012 vs. June, 2011
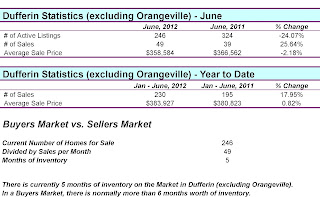
The number of active listings in Dufferin (excluding Orangeville) decreased by 24.07% in June, 2012 over the same month in 2011. The number of homes sold increased by 25.64% or 10 homes. Average sale prices were idecreased by 2.18%.

Year to Date, 2012 vs. Year to Date, 2011
The number of homes sold increased from 195 to 230 homes or 17.95%. Average sale prices were up year over year by 0.82%.

Caledon Market Statistics, June 2012


June, 2012 vs. June, 2011
The number of active listings in Caledon decreased by 1.76% in June, 2012 over the same month in 2011. 1 more listing came on the Toronto Board in June, 2012 vs. June, 2011, which is an increase of 0.69%. The number of homes sold decreased by 2 homes or 1.98%. The average days on the market increased from 29 to 37 days. Average sale prices were up by 12.39%.

Year to Date, 2012 vs. Year to Date, 2011
The number of homes listed in Caledon, year-to-date increased from 793 to 865, which is an increase of 9.08%. The number of homes sold increased by 23 homes or 5.28%. The average days on the market increased from 29 to 31. Average sale prices were up year over year by 10.34%

Wellington Market Statistics, June 2012


June, 2012 vs. June, 2011
The number of active listings in Wellington increased by 14.79% in June, 2012 over the same month in 2011. The number of homes sold increased by 38.18% from 55 to 76 sales. Average sale prices were down by 3.59%.

Year to Date, 2012 vs. Year to Date, 2011
The number of homes sold increased by 35.69%. Average sale prices decreased year over year by 7.78%.

2012 June Market Trends

Click on charts to enlarge.


Thursday, June 7, 2012

Orangeville Market Statistics, May 2012


May, 2012 vs. May, 2011The number of active listings in Orangeville decreased by 16.43% in May, 2012 vs. May, 2011.  19 fewer listings came on the Toronto Board in May, 2012 over the same month in 2011, which is a decrease of 20.43%. The number of homes sold increased by 5.48% or 4 homes. The average days on the market increased from 31 to 32 days. Average sale prices were up by 6.71%.

Year to Date, 2012 vs. Year to Date, 2011
The number of homes listed in Orangeville, year-to-date decreased from 423 to 410, which is a decrease of 3.07%. The number of homes sold increased by 6.72%. The average days on the market increased from 35 to 37 days. Average sale were up year over year by 5.59%.

Dufferin (excluding Orangeville) Market Statistics, May 2012


May, 2012 vs. May, 2011
The number of active listings in Dufferin (excluding Orangeville) increased by 0.38% in May, 2012 over the same month in 2011. The number of homes sold increased by 63.33% or 19 homes. Average sale prices were increased by 7.22%.

Year to Date, 2012 vs. Year to Date, 2011
The number of homes sold increased from 1131 to 183 homes or 39.69%. Average sale prices were up year over year by 11.01%.