Your source for local market statistics for areas serviced by the Royal LePage RCR Realty offices in Orangeville, Shelburne, and Alliston. Statistics are compiled from data posted on the Toronto Real Estate Board.
Friday, May 3, 2024
Orangeville Market Stats April 2024
Dufferin (excluding Orangeville) Market Stats April 2024
April 2024 vs. April 2023
The number of active listings in Dufferin (excluding Orangeville) increased by 26.86% in April 2024 over the same month in 2023. The number of homes sold increased by 3 homes or 8.11% in April 2024. Average sale prices increased by 7.21%.
Caledon Market Stats April 2024
April 2024 vs. April 2023
The number of active listings in Caledon increased by 63.68% in April 2024 over the same month in 2023. The number of listings that came on the Toronto Regional Real Estate Board in April 2024 vs. April 2023 increased by 75 homes or 47.77%. The number of homes sold increased by 11 homes or 14.10%. The average days on the market increased from 23 days to 30 days. Average sale prices were down by 0.45%.
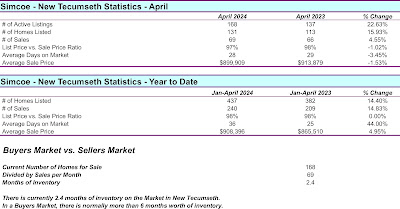
New Tecumseth Market Stats April 2024
The number of homes listed in New Tecumseth, year-to-date increased by 55 homes or 14.40%. The number of homes sold increased by 31 homes or 14.83%. The average days on the market increased by 11 days to 36 days. Average sale prices were up year over year by 4.95%
Wellington Market Stats April 2024

%20Stats%20April%202024.jpg)


%20Trends%20April%202024.jpg)


