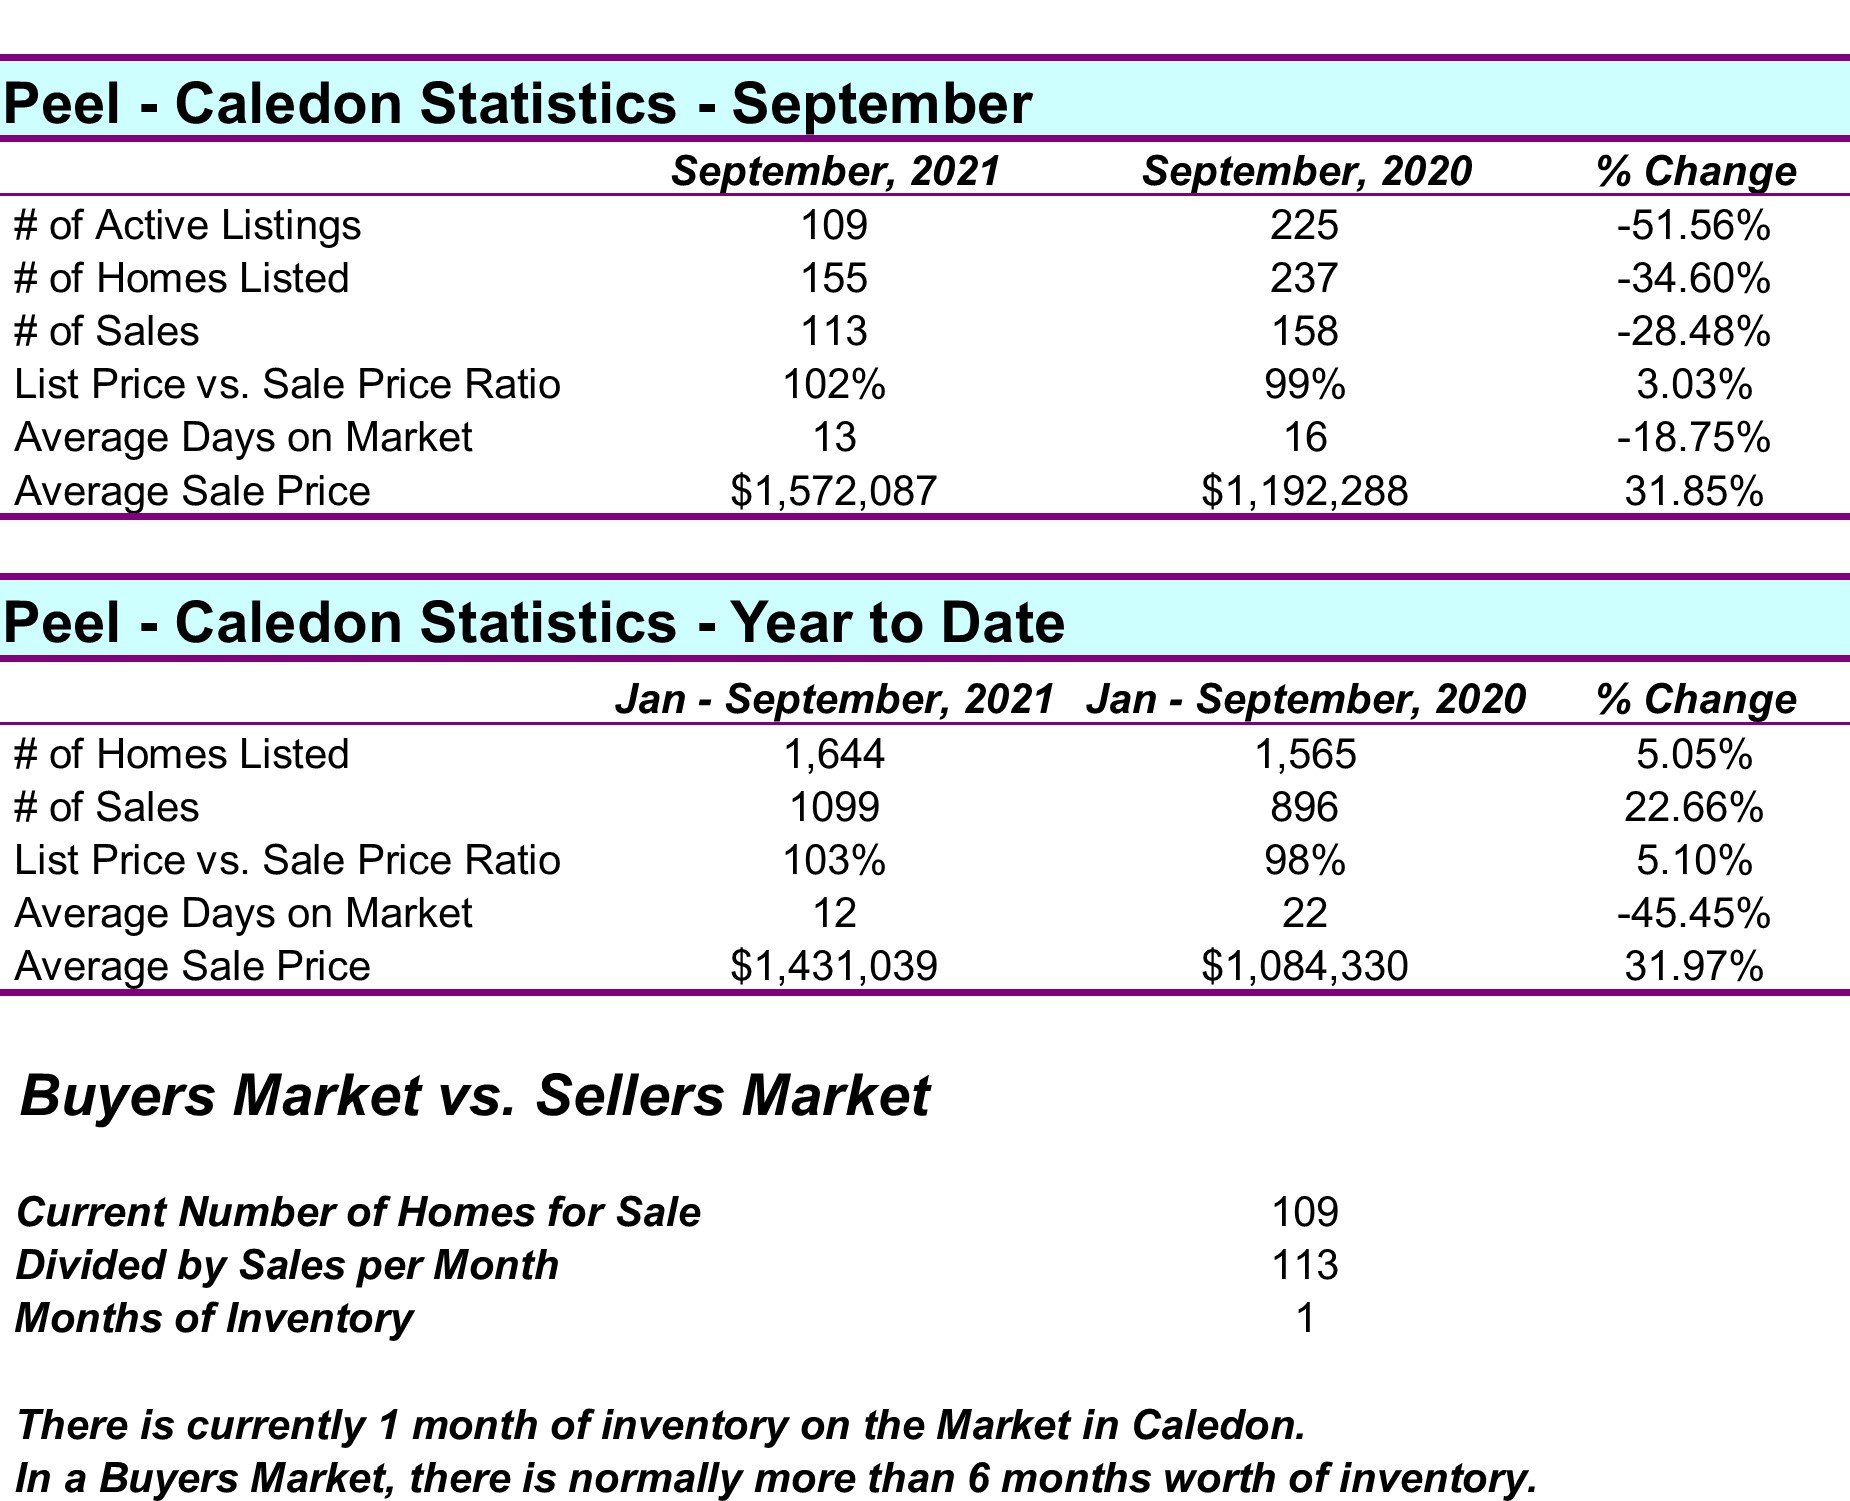
September 2021 vs. September 2020
The number of active listings in Caledon decreased by 51.56% in September 2021 over the same month in 2020. The number of listings that came on the Toronto Regional Real Estate Board in September 2021 vs. September 2020 decreased by 82 homes or 34.60%. The number of homes sold decreased by 45 homes or 28.48%. The average days on the market decreased from 16 days to 13 days. Average sale prices were up by 31.85%.
Year to Date 2021 vs. Year to Date 2020
The number of homes listed in Caledon, year-to-date increased from 1565 to 1644, which is an increase of 5.05%. The number of homes sold increased by 203 homes or 22.66%. The average days on market decreased from 22 days to 12 days. Average sale prices were up by 31.97%.
No comments:
Post a Comment