Friday, December 4, 2020

Orangeville Market Statistics, November 2020


November 2020 vs. November 2019
The number of active listings in Orangeville decreased by 63.27% in November 2020 vs. November 2019. 6 fewer listings came on the Toronto Board in November 2020 vs. November 2019, which is a decrease of 16.67%. The number of homes sold decreased by 1 home or 2.44%. The average days on the market went down from 35 to 13 days. Average sale prices were up by 9.14%.

Year to Date 2020 vs. Year to Date 2019
The number of homes listed in Orangeville, year-to-date decreased from 833 to 716, which is an decrease of 14.05%. The number of homes sold increased by 12 homes. The average days on the market decreased from 25 to 15 days. Average sale prices were up year over year by 13.00%. 

Dufferin Market Statistics, November 2020


November 2020 vs. November 2019
The number of active listings in Dufferin (excluding Orangeville) decreased by 47.55% in November 2020 over the same month in 2019. The number of homes sold increased by 17 homes or 47.22% in November 2020. Average sale prices increased by 54.96%.

Year to Date 2020 vs. Year to Date 2019
The number of homes sold increased by 119 homes in November 2020 over the same month in 2019. Average sale prices were up by 21.13%. 

Caledon Market Statistics, November 2020


November 2020 vs. November 2019
The number of active listings in Caledon decreased by 36.82% in November 2020 over the same month in 2019. The number of listings that came on the Toronto Board in November 2020 vs. November 2019 increased by 56 homes or 78.87%. The number of homes sold increased by 57 homes or 81.43%. The average days on the market decreased from 31 days to 21 days. Average sale prices were up by 21.21%. 

Year to Date 2020 vs. Year to Date 2019
The number of homes listed in Caledon, year-to-date increased from 1,851 to 1,880, which is a increase of 1.57%. The number of homes sold increased by 245 homes or 26.15%. The average days on market decreased from 29 days to 21 days. Average sale prices were up by 17.18%.

New Tecumseth Market Statistics, November 2020


November 2020 vs. November 2019

The number of active listings in New Tecumseth decreased from 155 to 66 homes or 57.42% in November 2020 over the same month in 2019. The amount of listings that came on the Toronto Real Estate Board decreased in November 2020 vs. November 2019. The number of homes sold decreased by 7 homes or 10.14%. The average days on the market decreased by 22 days, from 42 days to 20 days. Average sale prices were up by 28.75%.

Year to Date 2020 vs. Year to Date 2019
The number of homes listed in New Tecumseth, year-to-date decreased by 196 homes or 14.46%. The number of homes sold increased by 119 homes or 15.34%. The average days on the market decreased by 11 days, from 37 days to 26 days. Average sale prices were up year over year by 12.33%.

Wellington Market Statistics, November 2020


November 2020 vs. November 2019

The number of active listings in Wellington decreased by 54.74% in November 2020 over the same month in 2019. The number of homes sold increased by 53 sales or 46.90%. Average sale prices increased by 21.57%.

Year to Date 2020 vs. Year to Date 2019
The number of homes sold increased by 375 sales. Average sale prices increased year over year by 15.20%.  


November 2020 vs. November 2019
The number of active listings in Erin/Hillsburgh decreased by 15 listings or 36.59% in November 2020 over the same month in 2019. The number of homes sold decreased by 4 sales or 36.36%. Average sale prices decreased by 14.30%.

Year to Date 2020 vs. Year to Date 2019
The number of homes sold increased by 27 sales or 17.20%. Average sale prices increased year over year by 13.41%.

Thursday, December 3, 2020

Thursday, November 5, 2020

Orangeville Market Statistics, October 2020


October 2020 vs. October 2019
The number of active listings in Orangeville decreased by 47.62% in October 2020 vs. October 2019. 1 more listing came on the Toronto Board in October 2020 vs. October 2019, which is a increase of 1.37%. The number of homes sold decreased by 5 homes or 6.02%. The average days on the market went down from 26 to 14 days. Average sale prices were up by 12.70%.

Year to Date 2020 vs. Year to Date 2019
The number of homes listed in Orangeville, year-to-date decreased from 798 to 686, which is an decrease of 14.04%. The number of homes sold increased by 12 homes. The average days on the market decreased from 24 to 16 days. Average sale prices were up year over year by 13.33%. 

Dufferin Market Statistics, October 2020


October 2020 vs. October 2019
The number of active listings in Dufferin (excluding Orangeville) decreased by 47.70% in October 2020 over the same month in 2019. The number of homes sold increased by 19 homes or 32.20% in October 2020. Average sale prices increased by 21.98%.

Year to Date 2020 vs. Year to Date 2019
The number of homes sold increased by 102 homes in October 2020 over the same month in 2019. Average sale prices were up by 18.46%. 

Caledon Market Statistics, October 2020


October 2020 vs. October 2019
The number of active listings in Caledon decreased by 27.41% in October 2020 over the same month in 2019. The number of listings that came on the Toronto Board in October 2020 vs. October 2019 increased by 32 homes or 20.51%. The number of homes sold increased by 68 homes or 74.73%. The average days on the market decreased from 29 days to 18 days. Average sale prices were up by 26.35%. 

Year to Date 2020 vs. Year to Date 2019
The number of homes listed in Caledon, year-to-date decreased from 1,781 to 1,753, which is a decrease of 1.57%. The number of homes sold increased by 186 homes or 21.40%. The average days on market decreased from 29 days to 21 days. Average sale prices were up by 16.83%.

New Tecumseth Market Statistics, October 2020


October 2020 vs. October 2019

The number of active listings in New Tecumseth decreased from 196 to 77 homes or 60.71% in October 2020 over the same month in 2019. The amount of listings that came on the Toronto Real Estate Board decreased in October 2020 vs. October 2019. The number of homes sold increased by 18 homes or 21.18%. The average days on the market decreased by 21 days, from 38 days to 17 days. Average sale prices were up by 25.17%.

Year to Date 2020 vs. Year to Date 2019
The number of homes listed in New Tecumseth, year-to-date decreased by 190 homes or 14.81%. The number of homes sold increased by 127 homes or 17.96%. The average days on the market decreased by 11 days, from 37 days to 26 days. Average sale prices were up year over year by 11.13%.

Wellington Market Statistics, October 2020


October 2020 vs. October 2019

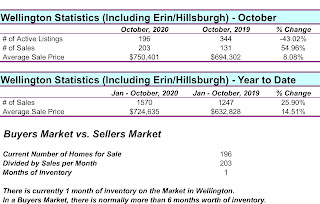
The number of active listings in Wellington decreased by 43.02% in October 2020 over the same month in 2019. The number of homes sold increased by 72 sales or 54.96%. Average sale prices increased by 8.08%.

Year to Date 2020 vs. Year to Date 2019
The number of homes sold increased by 323 sales. Average sale prices increased year over year by 14.51%.  


October 2020 vs. October 2019
The number of active listings in Erin/Hillsburgh decreased by 36 listings or 62.07% in October 2020 over the same month in 2019. The number of homes sold decreased by 4 sales or 16%. Average sale prices decreased by 2.35%.

Year to Date 2020 vs. Year to Date 2019
The number of homes sold increased by 32 sales or 21.92%. Average sale prices increased year over year by 15.08%.

October 2020 Market Statistics


Tuesday, October 6, 2020

Orangeville Market Statistics, September 2020


September 2020 vs. September 2019
The number of active listings in Orangeville decreased by 46.46% in September 2020 vs. September 2019. 9 more listings came on the Toronto Board in September 2020 vs. September 2019, which is a increase of 10.11%. The number of homes sold increased by 35 homes or 76.09%. The average days on the market went down from 24 to 11 days. Average sale prices were up by 16.59%.

Year to Date 2020 vs. Year to Date 2019
The number of homes listed in Orangeville, year-to-date decreased from 725 to 613, which is an decrease of 15.45%. The number of homes sold increased by 17 homes. The average days on the market decreased from 24 to 16 days. Average sale prices were up year over year by 13.49%.

Dufferin Market Statistics, September 2020


September 2020 vs. September 2019
The number of active listings in Dufferin (excluding Orangeville) decreased by 53.30% in September 2020 over the same month in 2019. The number of homes sold increased by 22 homes or 39.29% in September 2020. Average sale prices increased by 29.81%.

Year to Date 2020 vs. Year to Date 2019
The number of homes sold increased by 83 homes in September 2020 over the same month in 2019. Average sale prices were up by 17.65%.

Caledon Market Statistics, September 2020


September 2020 vs. September 2019
The number of active listings in Caledon decreased by 22.41% in September 2020 over the same month in 2019. The number of listings that came on the Toronto Board in September 2020 vs. September 2019 increased by 37 homes or 18.50%. The number of homes sold increased by 82 homes or 107.89%. The average days on the market decreased from 25 days to 16 days. Average sale prices were up by 15.11%. 

Year to Date 2020 vs. Year to Date 2019
The number of homes listed in Caledon, year-to-date decreased from 1,625 to 1,565, which is a decrease of 3.69%. The number of homes sold increased by 118 homes or 15.17%. The average days on market decreased from 29 days to 22 days. Average sale prices were up by 14.85%.

New Tecumseth Market Statistics, September 2020


September 2020 vs. September 2019

The number of active listings in New Tecumseth decreased from 228 to 102 homes or 55.26% in September 2020 over the same month in 2019. The amount of listings that came on the Toronto Real Estate Board decreased in September 2020 vs. September 2019. The number of homes sold increased by 48 homes or 75%. The average days on the market decreased by 16 days, from 43 days to 27 days. Average sale prices were up by 12.41%.

Year to Date 2020 vs. Year to Date 2019
The number of homes listed in New Tecumseth, year-to-date decreased by 183 homes or 15.52%. The number of homes sold increased by 109 homes or 17.52%. The average days on the market decreased by 9 days, from 37 days to 28 days. Average sale prices were up year over year by 9.26%.

Wellington Market Statistics, September 2020


September 2020 vs. September 2019
The number of active listings in Wellington decreased by 45.84% in September 2020 over the same month in 2019. The number of homes sold increased by 90 sales or 68.18%. Average sale prices increased by 29.29%.

Year to Date 2020 vs. Year to Date 2019
The number of homes sold increased by 251 sales. Average sale prices increased year over year by 15.87%.  


September 2020 vs. September 2019
The number of active listings in Erin/Hillsburgh decreased by 47 listings or 64.38% in September 2020 over the same month in 2019. The number of homes sold increased by 6 sales or 30%. Average sale prices increased by 22.18%.

Year to Date 2020 vs. Year to Date 2019
The number of homes sold increased by 36 sales or 29.75%. Average sale prices increased year over year by 19.34%.

September 2020 Market Statistics


Tuesday, September 8, 2020

Wellington Market Statistics, August 2020


August 2020 vs. August 2019
The number of active listings in Wellington decreased by 43.17% in August 2020 over the same month in 2019. The number of homes sold increased by 61 sales or 47.29%. Average sale prices increased by 18.48%.

Year to Date 2020 vs. Year to Date 2019
The number of homes sold increased by 161 sales. Average sale prices increased year over year by 13.15%.  


August 2020 vs. August 2019
The number of active listings in Erin/Hillsburgh decreased by 52 listings or 65.82% in August 2020 over the same month in 2019. The number of homes sold increased by 21 sales or 150.00%. Average sale prices increased by 11.44%.

Year to Date 2020 vs. Year to Date 2019
The number of homes sold increased by 30 sales or 29.70%. Average sale prices increased year over year by 18.75%.

New Tecumseth Market Statistics, August 2020


August 2020 vs. August 2019
The number of active listings in New Tecumseth decreased from 219 to 114 homes or 47.95% in August 2020 over the same month in 2019. The same amount of listings came on the Toronto Real Estate Board in August 2020 vs. August 2019. The number of homes sold increased by 55 homes or 72.37%. The average days on the market decreased by 11 days, from 32 days to 21 days. Average sale prices were up by 17.49%.

Year to Date 2020 vs. Year to Date 2019
The number of homes listed in New Tecumseth, year-to-date decreased by 172 homes or 16.43%. The number of homes sold increased by 62 homes or 11.11%. The average days on the market decreased by 8 days, from 36 days to 28 days. Average sale prices were up year over year by 8.62%.

Caledon Market Statistics, August 2020


August 2020 vs. August 2019
The number of active listings in Caledon decreased by 8.47% in August 2020 over the same month in 2019. The number of listings that came on the Toronto Board in August 2020 vs. August 2019 increased by 122 homes or 81.33%. The number of homes sold increased by 50 homes or 47.17%. The average days on the market decreased from 29 days to 16 days. Average sale prices were up by 17.88%. 

Year to Date 2020 vs. Year to Date 2019
The number of homes listed in Caledon, year-to-date decreased from 1,424 to 1,329, which is a decrease of 6.67%. The number of homes sold increased by 35 homes or 4.98%. The average days on market decreased from 30 days to 23 days. Average sale prices were up by 13.57%.

Dufferin Market Statistics, August 2020


August 2020 vs. August 2019
The number of active listings in Dufferin (excluding Orangeville) decreased by 53.81% in August 2020 over the same month in 2019. The number of homes sold increased by 32 homes or 74.42% in August 2020. Average sale prices increased by 16.33%.

Year to Date 2020 vs. Year to Date 2019
The number of homes sold increased by 60 homes in August 2020 over the same month in 2019. Average sale prices were up by 15.41%.

Orangeville Market Statistics, August 2020


August 2020 vs. August 2019
The number of active listings in Orangeville decreased by 48.24% in August 2020 vs. August 2019. 8 more listings came on the Toronto Board in August 2020 vs. August 2019, which is a increase of 11.43%. The number of homes sold increased by 7 homes or 11.48%. The average days on the market went down from 29 to 12 days. Average sale prices were up by 16.65%.

Year to Date 2020 vs. Year to Date 2019
The number of homes listed in Orangeville, year-to-date decreased from 636 to 515, which is an decrease of 19.03%. The number of homes sold decreased by 19 homes. The average days on the market decreased from 24 to 17 days. Average sale prices were up year over year by 12.76%.

Friday, September 4, 2020

Friday, August 7, 2020

Orangeville Market Statistics, July 2020


July 2020 vs. July 2019
The number of active listings in Orangeville decreased by 54.46% in July 2020 vs. July 2019. 7 more listings came on the Toronto Board in July 2020 vs. July 2019, which is a increase of 8.75%. The number of homes sold increased by 26 homes or 55.32%. The average days on the market went down from 28 to 16 days. Average sale prices were up by 15.66%.

Year to Date 2020 vs. Year to Date 2019
The number of homes listed in Orangeville, year-to-date decreased from 566 to 438, which is an decrease of 22.61%. The number of homes sold decreased by 27 homes. The average days on the market decreased from 23 to 18 days. Average sale prices were up year over year by 11.93%.

Dufferin Market Statistics, July 2020


July 2020 vs. July 2019
The number of active listings in Dufferin (excluding Orangeville) decreased by 48.42% in July 2020 over the same month in 2019. The number of homes sold increased by 37 homes or 75.51% in July 2020. Average sale prices increased by 28.79%.

Year to Date 2020 vs. Year to Date 2019
The number of homes sold increased by 28 homes in July 2020 over the same month in 2019. Average sale prices were up by 13.62%.

Caledon Market Statistics, July 2020


July 2020 vs. July 2019
The number of active listings in Caledon decreased by 33.45% in July 2020 over the same month in 2019. The number of listings that came on the Toronto Board in July 2020 vs. July 2019 increased by 30 homes or 16.67%. The number of homes sold increased by 75 homes or 69.44%. The average days on the market decreased from 27 days to 22 days. Average sale prices were up by 21.85%. 

Year to Date 2020 vs. Year to Date 2019
The number of homes listed in Caledon, year-to-date decreased from 1,274 to 1,057, which is a decrease of 17.03%. The number of homes sold decreased by 13 homes or 2.18%. The average days on market decreased from 30 days to 25 days. Average sale prices were up by 12.37%.