
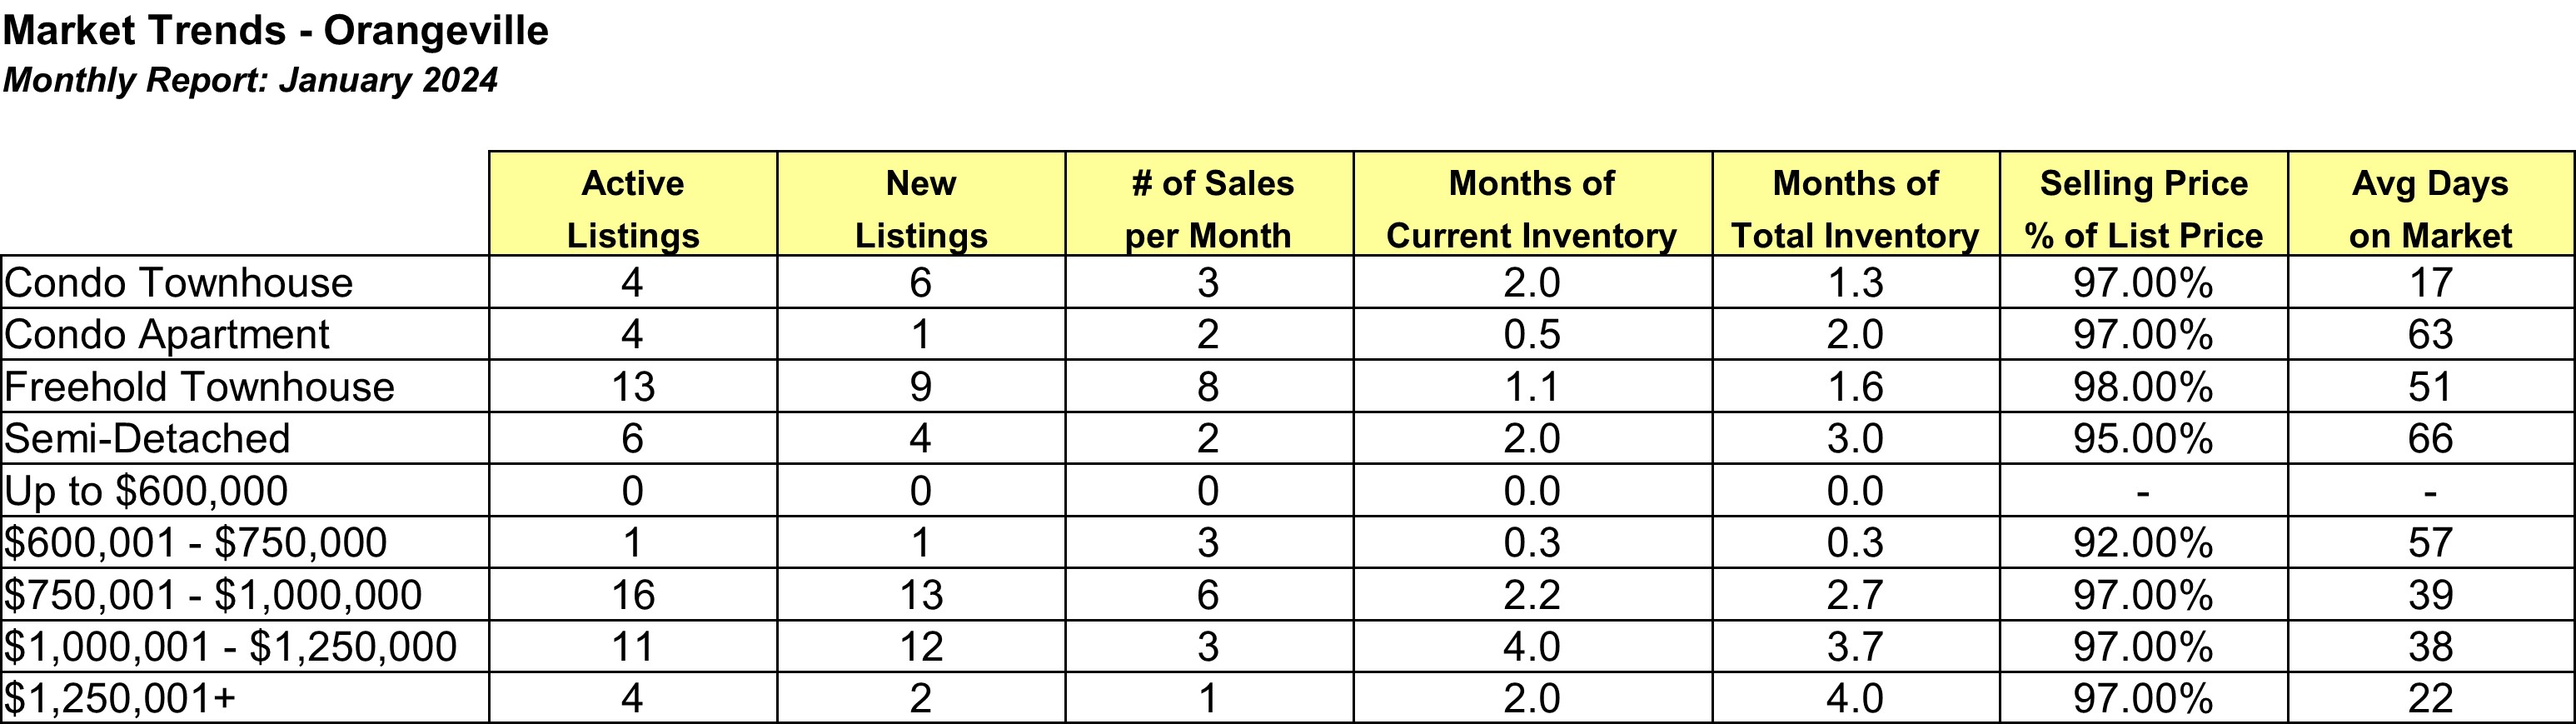
January 2024 vs. January 2023
The number of active listings in Orangeville increased by 21.43% in January 2024 vs. January 2023. 12 more listing came on the Toronto Regional Real Estate Board in January 2024 vs. January 2023, which is an increase of 33.33%. The number of homes sold increased by 7 homes or 33.33%. The average days on the market increased from 39 days to 45 days. Average sale prices were down by 7.92%.
%20Stats%20January%202024.jpg)


%20Market%20Trends%20January%202024.jpg)


