Tuesday, February 6, 2024

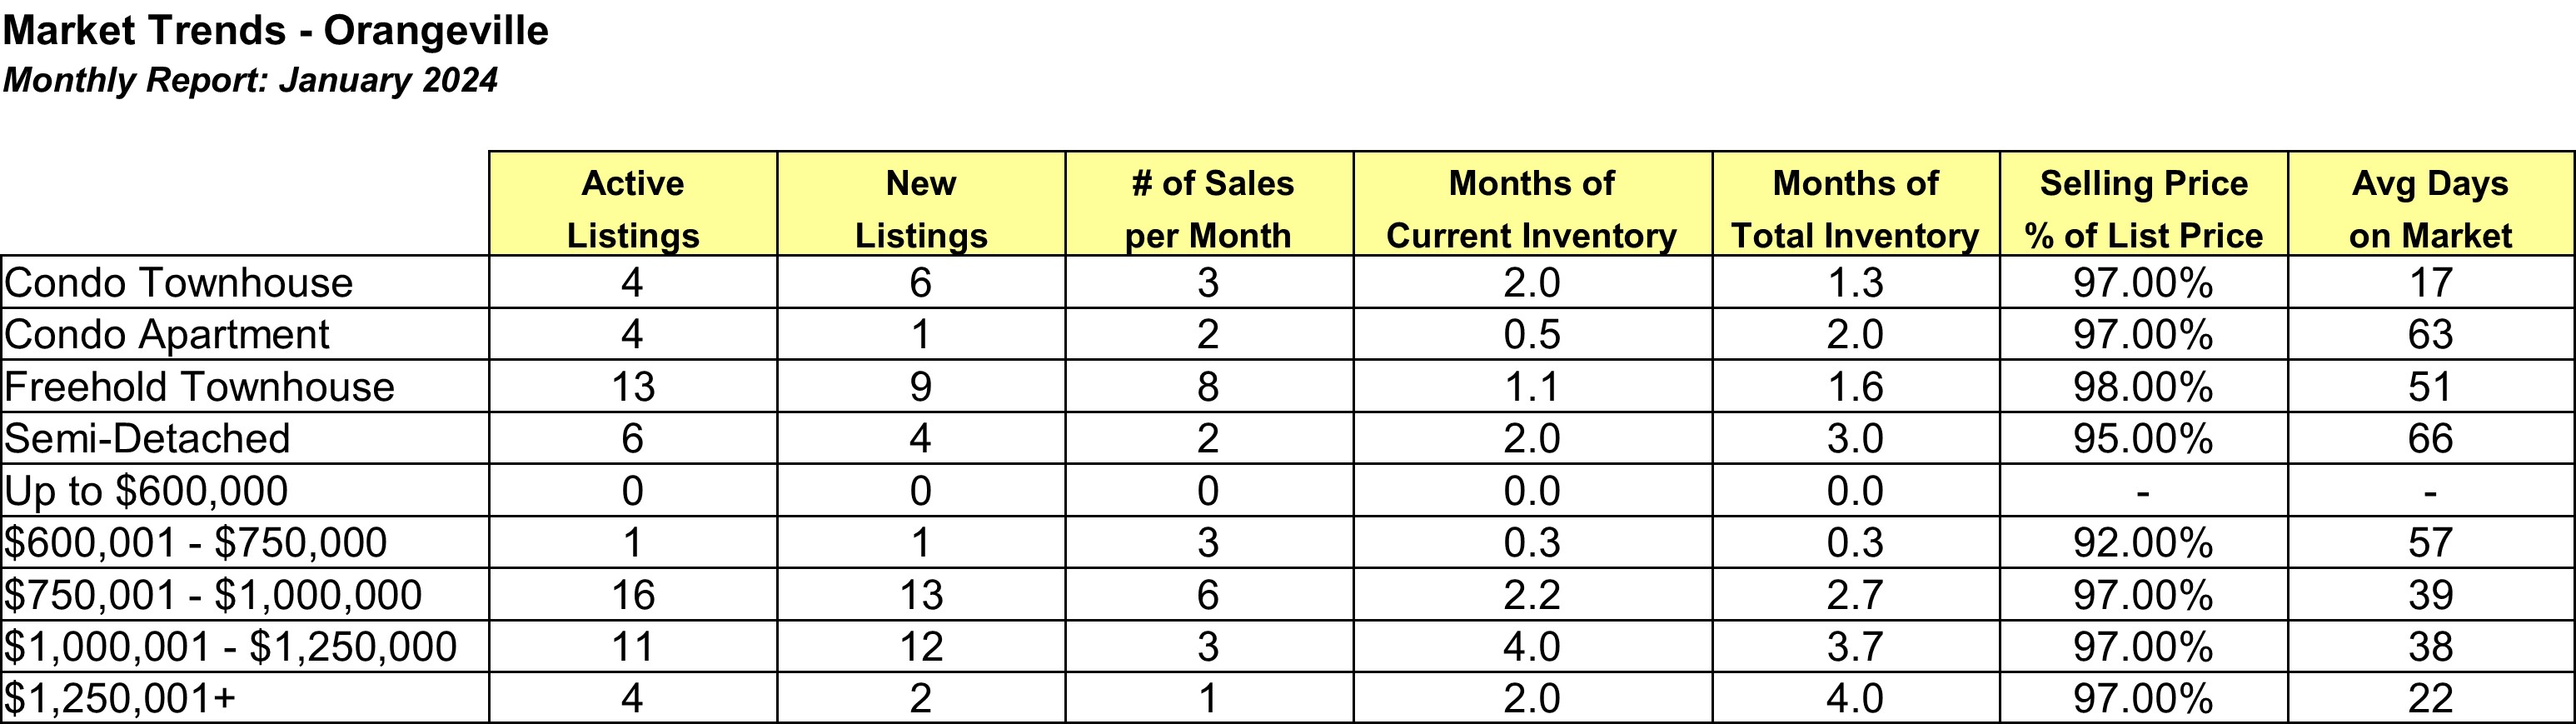
January 2024 Market Trends


Thursday, January 4, 2024

Orangeville Market Stats December 2023


December 2023 vs. December 2022
The number of active listings in Orangeville increased by 17.39% in December 2023 vs. December 2022. 1 more listing came on the Toronto Regional Real Estate Board in December 2023 vs. December 2022, which is an increase of 6.67%. The number of homes sold increased by 2 homes or 11.76%. The average days on the market decreased from 38 days to 31 days. Average sale prices were up by 4.67%.

Year to Date 2023 vs. Year to Date 2022
The number of homes listed in Orangeville, year-to-date decreased from 896 to 748, which is a decrease of 16.52%. The number of homes sold decreased from 493 to 408 which is a decrease of 17.24%. The average days on the market increased by 3 days to 20 days. Average sale prices were down year over year by 9.44%.

Dufferin (excluding Orangeville) Market Stats December 2023


December 2023 vs. December 2022
The number of active listings in Dufferin (excluding Orangeville) increased by 1.29% in December 2023 over the same month in 2022. The number of homes sold decreased by 4
 homes or 16.00% in December 2023. Average sale prices decreased by 7.28%.


Year to Date 2023 vs. Year to Date 2022
The number of homes sold in Dufferin (excluding Orangeville), year-to-date decreased from 427 to 402, which is a decrease of 5.85%. Average sale prices were down by 7.66%.

Caledon Market Stats December 2023


December 2023 vs. December 2022
The number of active listings in Caledon increased by 11.86% in December 2023 over the same month in 2022. The number of listings that came on the Toronto Regional Real Estate Board in December 2023 vs. December 2022 increased by 8 homes or 12.50%. The number of homes sold increased by 9 homes or 30.00%. The average days on the market increased from 32 days to 36 days. Average sale prices were up by 50.03%. 


Year to Date 2023 vs. Year to Date 2022
The number of homes listed in Caledon, year-to-date increased from 2,040 to 2,082, which is an increase of 2.06%. The number of homes sold decreased by 33 homes or 4.17%. The average days on market increased by 7 days to 25 days. Average sale prices were down by 11.25%

New Tecumseth Market Stats December 2023


December 2023 vs. December 2022
The number of active listings in New Tecumseth increased from 101 to 105 homes or 3.96% in December 2023 over the same month in 2022. The number of listings that came on the Toronto Regional Real Estate Board decreased from 38 to 35 or 7.89% in December 2023 vs. December 2022. The number of homes sold decreased by 4 homes or 18.18%. The average days on the market decreased from 44 to 25 days or 43.18%. Average sale prices were up by 1.09%.

Year to Date 2023 vs. Year to Date 2022
The number of homes listed in New Tecumseth, year-to-date decreased by 283 homes or 18.78%. The number of homes sold decreased by 85 homes or 13.02%. The average days on the market increased by 6 days to 26 days. Average sale prices were down year over year by 10.79%

Wellington Market Stats December 2023


December 2023 vs. December 2022
The number of active listings in Wellington increased by 44.18% in December 2023 over the same month in 2022. The number of homes sold decreased by 3 sales or 3.85%. Average sale prices decreased by 8.67%.

Year to Date 2023 vs. Year to Date 2022
The number of homes sold decreased by 32 sales. Average sale prices decreased year over year by 10.03%.  


December 2023 vs. December 2022
The number of active listings in Erin/Hillsburgh remained the same in December 2023 over the same month in 2022. The number of homes sold decreased by 2 sales or 40.0%. Average sale prices increased by 15.94%.

Year to Date 2023 vs. Year to Date 2022
The number of homes sold increased by 19 sales or 16.10%. Average sale prices decreased by 9.96%  year over year.

December 2023 Market Trends