Thursday, October 5, 2023

Caledon Market Stats September 2023


September 2023 vs. September 2022
The number of active listings in Caledon increased by 43.25% in September 2023 over the same month in 2022. The number of listings that came on the Toronto Regional Real Estate Board in September 2023 vs. September 2022 increased by 94 homes or 60.26%. The number of homes sold decreased by 20 homes or 30.77%. The average days on the market decreased from 29 days to 27 days. Average sale prices were up by 0.45%. 


Year to Date 2023 vs. Year to Date 2022
The number of homes listed in Caledon, year-to-date decreased from 1,676 to 1,650, which is a decrease of 1.55%. The number of homes sold decreased by 39 homes or 5.91%. The average days on market increased by 8 days to 24 days. Average sale prices were down by 15.26%

September 2023 Market Trends


Thursday, September 7, 2023

Orangeville Market Stats August 2023


August 2023 vs. August 2022
The number of active listings in Orangeville decreased by 16.67% in August 2023 vs. August 2022. 9 more listings came on the Toronto Regional Real Estate Board in August 2023 vs. August 2022, which is an increase of 14.06%. The number of homes sold decreased by 14 homes or 31.82%. The average days on the market decreased from 28 days to 27 days. Average sale prices were up by 1.74%.

Year to Date 2023 vs. Year to Date 2022
The number of homes listed in Orangeville, year-to-date decreased from 734 to 496, which is a decrease of 32.43%. The number of homes sold decreased from 386 to 303 which is a decrease of 21.50%. The average days on the market increased by 7 days to 19 days. Average sale prices were down year over year by 12.16%.

Dufferin (excluding Orangeville) Market Stats August 2023


August 2023 vs. August 2022
The number of active listings in Dufferin (excluding Orangeville) increased by 3.23% in August 2023 over the same month in 2022. The number of homes sold increased by 15
 homes or 55.56% in August 2023. Average sale prices increased by 8.22%.


Year to Date 2023 vs. Year to Date 2022
The number of homes sold in Dufferin (excluding Orangeville), year-to-date decreased from 315 to 297, which is a decrease of 5.71%. Average sale prices were down by 11.37%.

New Tecumseth Market Stats August 2023


August 2023 vs. August 2022
The number of active listings in New Tecumseth decreased from 189 to 180 homes or 4.76% in August 2023 over the same month in 2022. The number of listings that came on the Toronto Regional Real Estate Board decreased from 126 to 118 or 6.35% in August 2023 vs. August 2022. The number of homes sold decreased by 6 homes or 12.24%. The average days on the market decreased from 23 to 21 days or 8.70%. Average sale prices were up by 1.33%.

Year to Date 2023 vs. Year to Date 2022
The number of homes listed in New Tecumseth, year-to-date decreased by 321 homes or 27.13%. The number of homes sold decreased by 43 homes or 8.69%. The average days on the market increased by 9 days to 24 days. Average sale prices were down year over year by 14.52%

Wellington Market Stats August 2023


August 2023 vs. August 2022
The number of active listings in Wellington increased by 9.22% in August 2023 over the same month in 2022. The number of homes sold increased by 38 sales or 32.20%. Average sale prices decreased by 8.43%.

Year to Date 2023 vs. Year to Date 2022
The number of homes sold decreased by 11 sales. Average sale prices decreased year over year by 13.15%.  


August 2023 vs. August 2022
The number of active listings in Erin/Hillsburgh increased by 4 listings or 8.00% in August 2023 over the same month in 2022. The number of homes sold increased by 3 sales or 42.86%. Average sale prices decreased by 5.47%.

Year to Date 2023 vs. Year to Date 2022
The number of homes sold increased by 18 sales or 18.95%. Average sale prices increased by 0.39%  year over year.

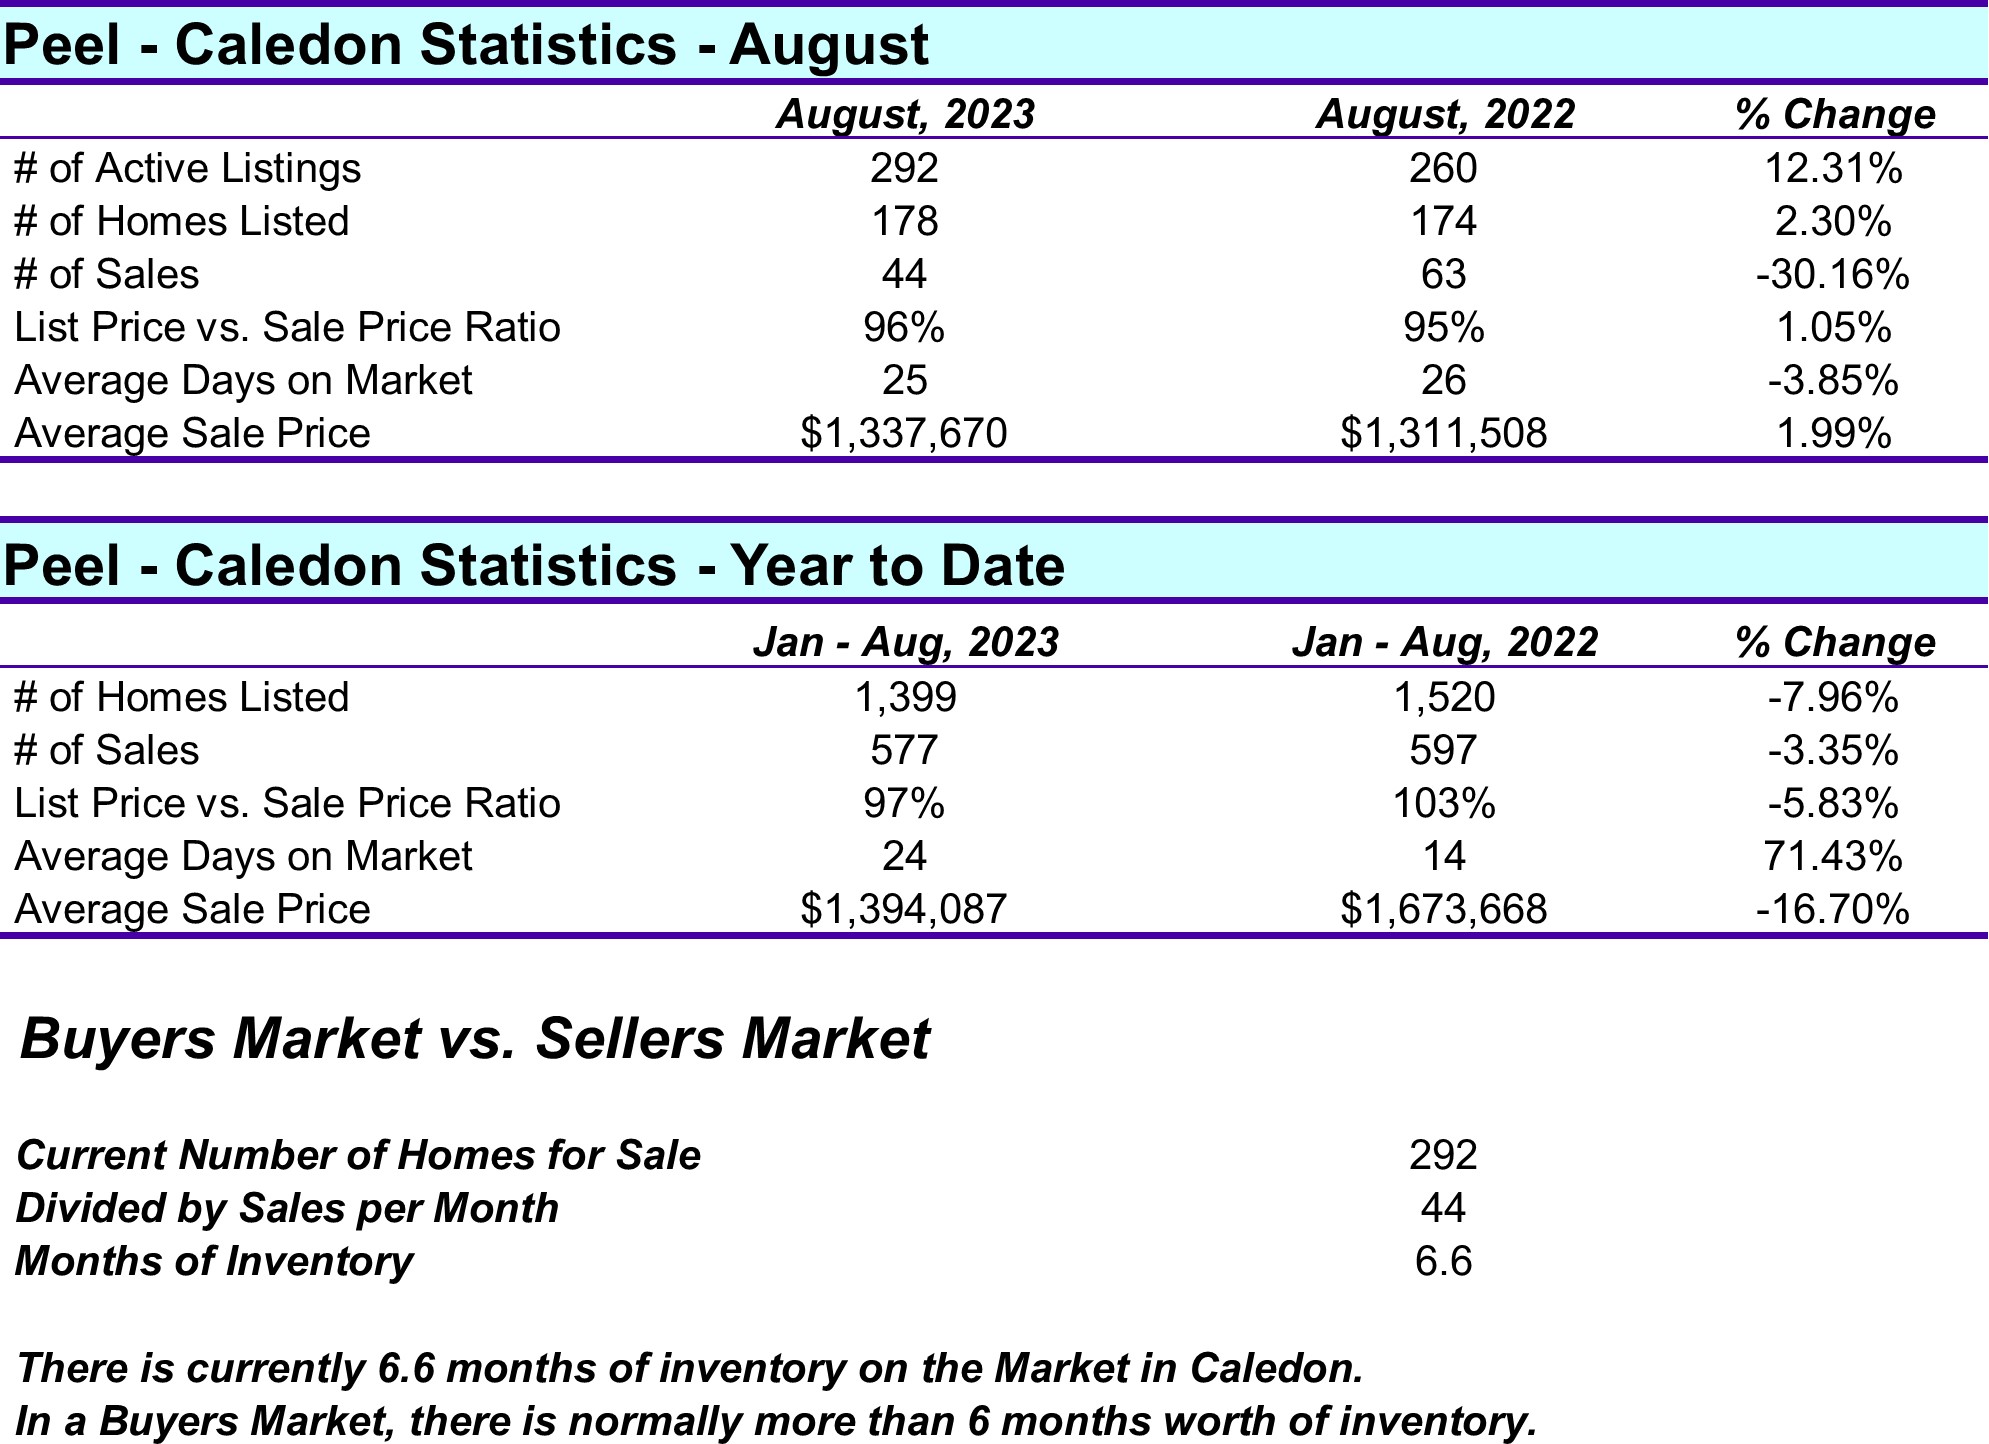
Caledon Market Stats August 2023


August 2023 vs. August 2022
The number of active listings in Caledon increased by 12.31% in August 2023 over the same month in 2022. The number of listings that came on the Toronto Regional Real Estate Board in August 2023 vs. August 2022 increased by 4 homes or 2.30%. The number of homes sold decreased by 19 homes or 30.166%. The average days on the market decreased from 26 days to 25 days. Average sale prices were up by 1.99%. 


Year to Date 2023 vs. Year to Date 2022
The number of homes listed in Caledon, year-to-date decreased from 1,520 to 1,399, which is a decrease of 7.96%. The number of homes sold decreased by 20 home or 3.35%. The average days on market increased by 10 days to 24 days. Average sale prices were down by 16.70%